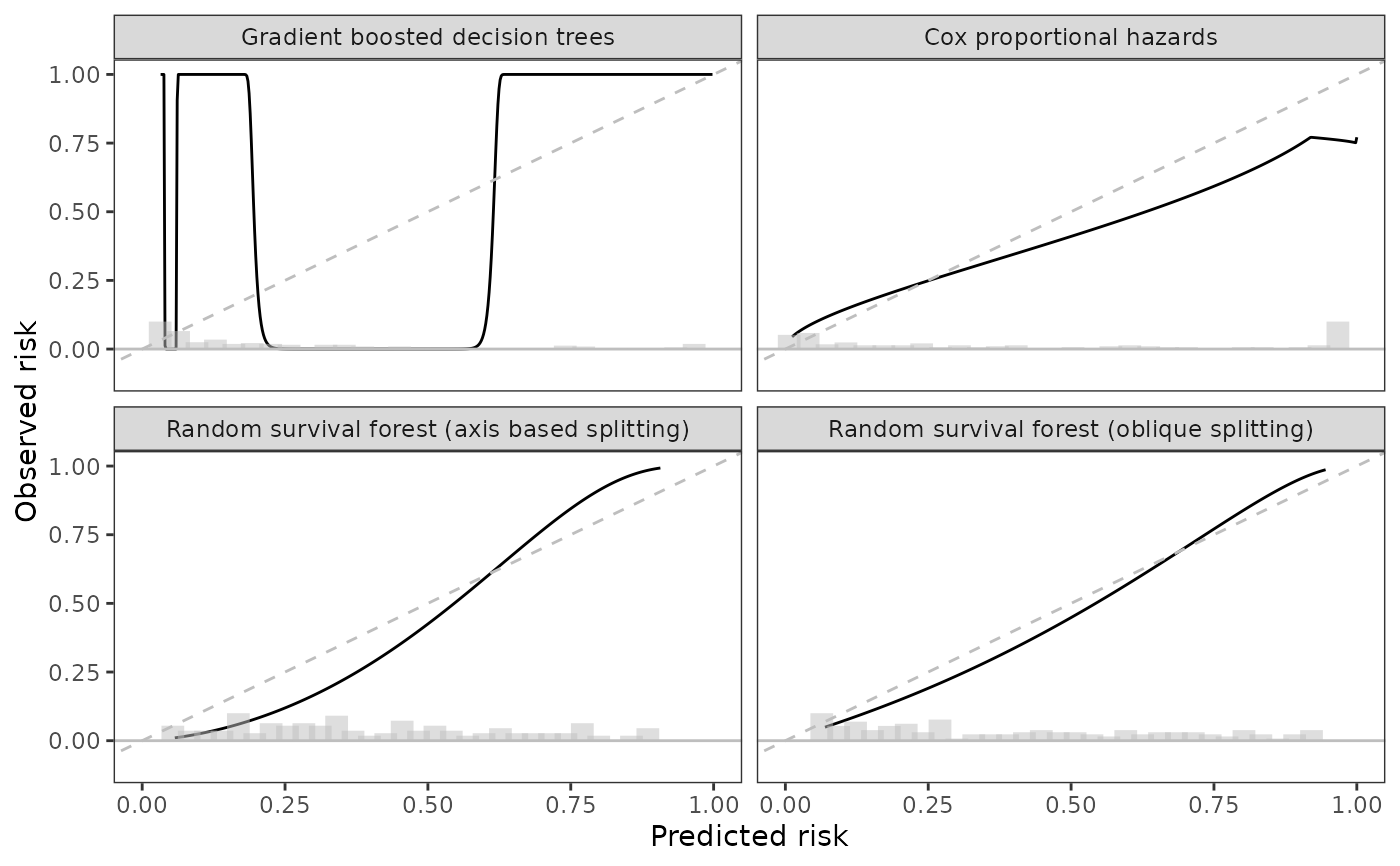
TODO: add description
scalib_hare(
  scalib_object,
  verbose = 0,
  hare_penalty = NULL,
  hare_max_dimension = NULL,
  hare_prophaz = FALSE,
  hare_additive = FALSE,
  hare_linear_risk = FALSE,
  hare_linear_time = FALSE,
  hare_fit = NULL
)
Arguments
- scalib_object
An object of class
scalib(see scalib).- verbose
(integer value) If 0, no output will be printed. If 1, some output will be printed. If 2, all output will be printed.
- hare_penalty
the parameter to be used in the AIC criterion. The method chooses the number of knots that minimizes
-2 * loglikelihood + penalty * (dimension). The default is to use penalty = log(samplesize) as in BIC. The effect of this parameter is summarized in summary.hare.- hare_max_dimension
maximum dimension (default is
6 * length(data)^0.2.- hare_prophaz
should the model selection be restricted to proportional hazards models?
- hare_additive
should the model selection be restricted to additive models?
- hare_linear_risk
(logical value) should the effect of risk be linear?
- hare_linear_time
(logical value) should the effect of time be linear?
- hare_fit
hare object. If
fitis specified, hare adds basis functions starting with those in fit.
Value
an object of class scalib
Examples
# packages
library(ggplot2)
library(tidyr)
library(dplyr)
#>
#> Attaching package: ‘dplyr’
#> The following objects are masked from ‘package:data.table’:
#>
#>     between, first, last
#> The following objects are masked from ‘package:stats’:
#>
#>     filter, lag
#> The following objects are masked from ‘package:base’:
#>
#>     intersect, setdiff, setequal, union

sc <- scalib(pred_risk = pbc_scalib$predrisk,
             pred_horizon = 2500,
             event_time = pbc_scalib$test$time,
             event_status = pbc_scalib$test$status)

sc_hare <- scalib_hare(sc)

print(sc_hare)
#>
#> Survival calibration object with prediction horizon of 2500
#>
#> -- Input data ----------------------------------------------------------------
#>
#>      event_time event_status prop_hazard rsf_axis gradient_booster rsf_oblique
#>           <int>        <num>       <num>    <num>            <num>       <num>
#>   1:        400            1      0.9990   0.9026           0.9351      0.9463
#>   2:       4500            0      0.4272   0.3072           0.0524      0.3680
#>   3:       1925            1      0.8286   0.4722           0.2342      0.5982
#>   4:       1832            0      0.0358   0.1474           0.0422      0.1460
#>   5:       2466            1      0.0392   0.1925           0.0568      0.1558
#>  ---
#> 134:       1300            0      0.1509   0.1783           0.0629      0.1669
#> 135:       1293            0      0.1805   0.3466           0.1299      0.2416
#> 136:       1250            0      0.9823   0.4743           0.3254      0.5727
#> 137:       1230            0      0.0182   0.0589           0.0322      0.0637
#> 138:       1153            0      0.0718   0.1637           0.0527      0.1220
#>
#>
#> -- Output data -------------------------------------------------------------
#>
#> Key: <._id_.>
#>              ._id_. hare_ici hare_e50 hare_e90 hare_emax      hare_data_plot
#>              <char>    <num>    <num>    <num>     <num>              <list>
#> 1: gradient_booster   0.5104   0.4045   0.9358     0.969 <data.table[500x2]>
#> 2:      prop_hazard   0.1008   0.0454   0.2404     0.248 <data.table[500x2]>
#> 3:         rsf_axis   0.0999   0.1068   0.1335     0.836 <data.table[500x2]>
#> 4:      rsf_oblique   0.0417   0.0449   0.0622     0.065 <data.table[500x2]>
#> 1 variable not shown: [hare_data_smry <list>]
#>

data_gg <- sc_hare$data_outputs |>
  select(._id_., hare_data_plot) |>
  unnest(hare_data_plot)

data_bins <- predrisk_bin_segments(sc_hare, bin_count = 30) |>
 mutate(._id_.)

id_labels <- c(prop_hazard = "Cox proportional hazards",
               rsf_axis = "Random survival forest (axis based splitting)",
               gradient_booster = "Gradient boosted decision trees",
               rsf_oblique = "Random survival forest (oblique splitting)")

ggplot(data_gg) +
  aes(x = predicted, y = observed) +
  geom_line() +
  geom_abline(col = 'grey', linetype = 2) +
  geom_hline(yintercept = 0, col = 'grey') +
  theme_bw() +
  theme(panel.grid = element_blank()) +
  coord_cartesian(xlim = c(0, 1),
                  ylim = c(-0.1, 1)) +
  geom_segment(data = data_bins,
               size = 4,
               alpha = 0.50,
               col = 'grey',
               mapping = aes(x = x,
                             y = y,
                             xend = xend,
                             yend = yend)) +
 facet_wrap(~._id_., labeller = labeller(._id_. = id_labels)) +
 labs(x = 'Predicted risk', y = 'Observed risk')
